The US may have forgotten that too much liquidity is a bad thing, writes Schalk Louw.
The Great Depression was a global economic depression that originated in the US in 1929.
Just one year before this significant event, a group called Famous Myers Jubilee Singers released the spiritual song, Dem Bones. Today, it is better known as a children’s song and nursery rhyme:
“The toe bone’s connected to the foot bone
The foot bone’s connected to the heel bone
The heel bone’s connected to the ankle bone
The ankle bone’s connected to the leg bone”
For those of you who are not so familiar with it, this song explains how all the bones in our body are actually connected to each other.
I can’t help but think of this song as I grapple with the interconnectedness of the problems with the US economy.
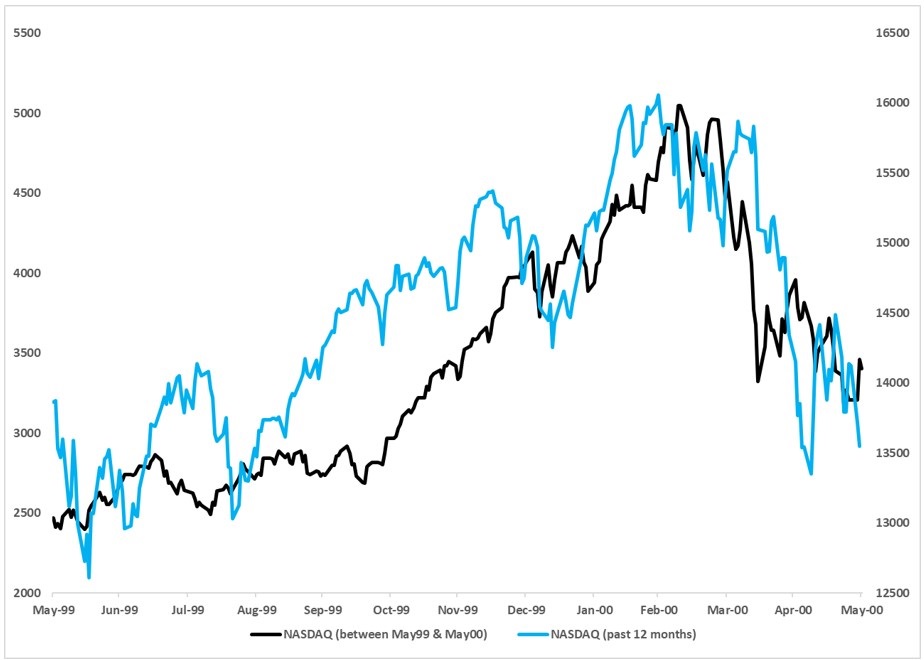
Let's start at the beginning. During the late 1990s, predictions that the so-called “dot-com bubble” would burst soon were on the rise.
But following the 1997 Asian financial crisis and a mini-crash that followed in October of the same year, the economy looked firm, and the Federal Reserve (Fed) decided to increase interest rates six times between June 1999 and May 2000.
The term “soft landing” started to do the rounds, which referred to the Fed’s plan to cool down the economy without any significant crashes. But the result was everything but a soft landing.
The tech-heavy Nasdaq bubble officially burst in March 2000, and it didn’t stop there. After interest rates increased for the last time in May 2000, the Nasdaq not only declined by a further 67% between May 2000 and September 2002, but US economic growth weakened significantly after that. In fact, the third quarter of 2000 saw the slowest GDP growth since 1992.
Things went from bad to worse, and by March 2001 there was a full-blown recession that lasted for eight months until November 2001. That same year brought the 9 September 2001 terror attacks, followed by the war in Afghanistan.
The US Congress grew desperate, and on 9 June 2001, President George W. Bush signed the “Economic Growth and Tax Relief Reconciliation Act of 2001” (EGTRRA), which provided massive personal tax relief for US citizens.
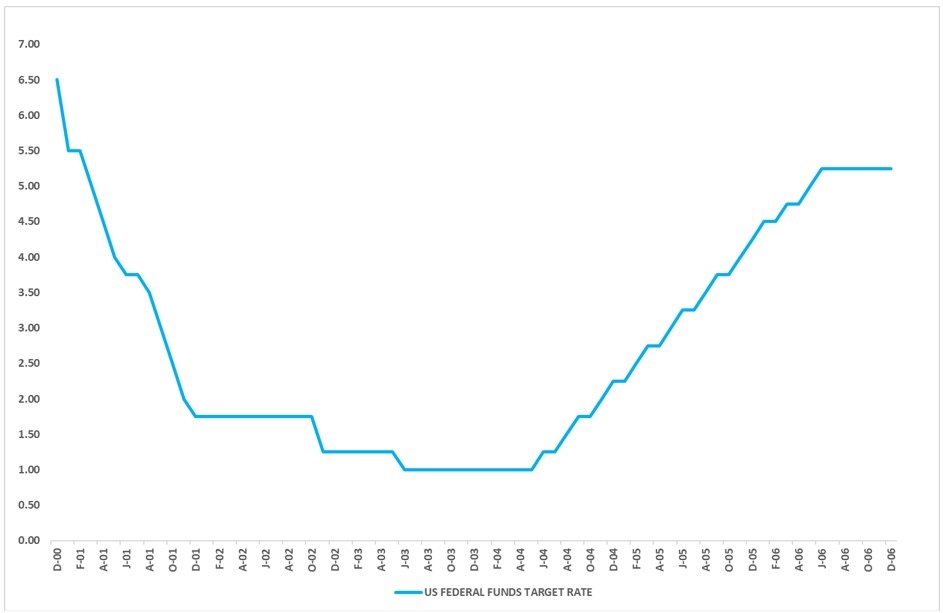
In January 2001, the Fed started with a series of interest rate cuts. Make no mistake here. They knew that they were in big trouble, and they didn’t just cut interest rates by one or two percent. They literally dragged the key federal funds rate from 6.5% to 1% between January 2001 and June 2003. This was done mainly in an attempt to stimulate the economy and increase liquidity.
This process later repeated itself.
The sharp rate cuts contributed towards what later became known as the “housing and credit bubble”.
Economic growth paired with an incredibly low interest rate- and tax environment made accessing credit very easy, which in turn caused house prices and credit demand to boom.
In 2006 the housing bubble reached its peak, and not unlike the dot-com bubble six years prior, in 2007, it burst. As the US had not yet fully recovered from the previous crisis, they were now in even bigger trouble than before.
Once again, the Fed intervened.
Let’s be honest, at this stage, if the USA was a company, this was as close to bankruptcy as you could get.
The Fed’s reaction to this was twofold. Firstly, to create market liquidity and secondly, to establish macroeconomic targets through monetary policy (interest rate cuts).
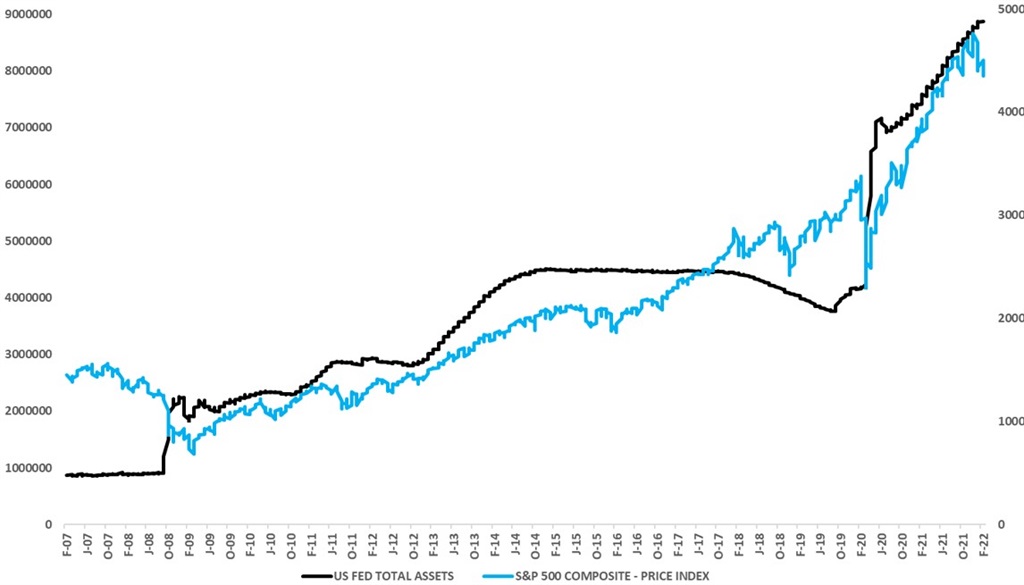
Interest rates were cut dramatically yet again, but not down to the 1% to 2% levels we saw in the early 2000s. This time the federal funds rate declined from 5.25% to 0.25% in December 2008. We also witnessed the birth of Quantitative Easing (or the QE programme), which basically meant that the US started to print money to provide support to banks and then repurchased these loans onto the Fed’s balance sheet. The Fed announced the original programme in November 2008 for $600bn.
That didn’t last very long, as in March 2009, the Fed decided to increase their balance sheet, and they announced that an additional $570bn in government-sponsored enterprise mortgage-backed securities would be purchased. In other words, they would throw new good quality money at very bad debt.
In a media interview in 2009, the Federal Reserve Chairman, Ben Bernanke, said the same thing.
To quote: “Well, this fear of inflation, I think is way overstated. We've looked at it very, very carefully. We've analysed it every which way. One myth that's out there is that what we're doing is printing money. We're not printing money. The amount of currency in circulation is not changing. The money supply is not changing in any significant way.”
In a follow-up interview on 5 December 2010, while being confronted with the fact that they were, in reality, printing money, his answer was: “Well, effectively, and we need to do that, because our economy is very weak and inflation is very low. When the economy begins to recover, that will be the time that we need to unwind those programs, raise interest rates, reduce the money supply, and make sure that we have a recovery that does not involve inflation."
For the next four years, new rounds of QE were launched, and by then it had started to sound like the “Rocky” movie franchise (1, 2, 3, 4...). But the US got through the Great Recession, and at the end of December 2015, they decided to start with interest rate hikes, which was done relatively slowly. In September 2017, the Fed announced that they would begin with Quantitative Tightening (QT) – the process of reducing the Fed’s balance sheet.
Over the next two years, the Fed managed to reduce its balance sheet by $700 billion, which caused sudden volatility in local markets (including the S&P500).
But markets still managed to move forward somehow. During the middle of September 2019, the US repo rate suddenly “spiked and exhibited significant volatility” (Fed Notes). This gave the Fed quite a big scare, and they were fearful that QT may have broken the market. As a result, the QT process was stopped immediately. The Fed’s balance sheet increased by a further $400 billion. And then Covid-19 struck.
I don’t need to explain what happened next as this is still very fresh in our minds.
The Fed decided to continue with economic stimulation to create even more liquidity. Not only has the Fed’s balance sheet grown by $4.7 trillion since the end of February 2020, but the amount of money in circulation in the US (M2 money supply) is 40% higher today. Over the same period, and with all this money circulating, we saw an increase in inflation in the USA (year on year) in January 2022 to 7.5%, the biggest increase in 40 years.
At the end of last year, the Fed announced that they would once again be starting a tapering process, and in February 2022, indicated that interest rates in the US must rise.
All of these events (dot-com bubble, recession, housing and credit crisis, the great recession and Covid-19) cannot be seen in isolation. Take a step back, and you will realise that “The toe bone’s connected to the foot bone. The foot bone’s connected to the heel bone...”
Will the US manage to get itself out of this predicament successfully? Will the US market and even other world markets manage to emerge unscathed if they don’t?
Former Federal Reserve Chair Paul Volcker, who had to guide the US out of stagflation in the 1970s, once said, “When you hear complaints about less liquidity, remember there is such a thing as too much liquidity”.
To me, it seems as if the US has forgotten this.
Schalk Louw is a portfolio manager and strategist at PSG Wealth Old Oak. Views expressed are his own.


 Publications
 Partners


