Publications
 Partners


Workhorse Group is a share that could probably benefit from a Biden administration.
Joe Biden became the 46th president of the United States on 20 January, and he took the reins during a time of national discomfort in the face of four crises: the Covid-19 pandemic, the economic downturn, climate change and racial inequality. He promised immediate action, and signed a number of executive orders on his first day in office.
But what does this “blue (Democratic) wave” mean for the stock market?
President Biden has promised to govern as a centrist, which is a political policy that strikes a balance between social equality and a degree of social hierarchy while opposing political change that will lead to society shifting to either the left or right. To me it sounds like six of one versus half a dozen of the other. Biden wants to “build better” with an emphasis on renewable energy and modern infrastructure.
These priorities will probably be welcomed by a Democrat-controlled Congress without inviting a filibuster from the Republican senators.
This brings the American presidential election to mind.
This points to the presidential election having a predictable impact on economic policy and market sentiment in the US, regardless of the specific presidential policy.
According to the theory, the stock markets will start to improve in the second year after the election, 2022. In the third and fourth year, the president starts with his re-election campaign. A strong economy is an excellent way of garnering votes. So the president will probably prioritise efforts aimed at heating up the economy. Should these efforts succeed, it would logically have a positive impact on stock markets.
Some investors use the presidential cycle to time the market. The cycle has, however, lost its predictive power. In the 21st century the stock market increased in the initial year of a presidency. The S&P 500 rose in the first year of the Trump, Bush and Obama administrations. But there is some method in this madness, as history repeats itself.
But do not use this theory as the only instrument to analyse the market. Also consider factors that could affect the economic and market conditions. The timing of the term of office relative to the stock market is just one of the factors that influence market risk. Other factors could include investor psychology, interest rates and the performance of the world economy.
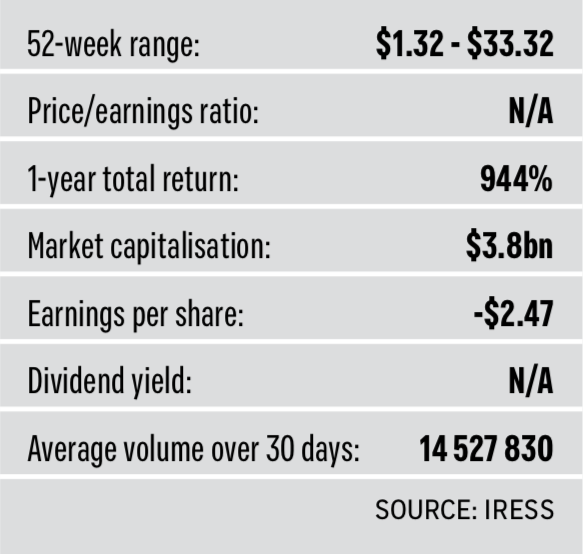
There are, however, shares that could benefit from Biden’s presidency. This is where Workhorse Group caught my eye. The code for the share is WKHS and it’s listed on the Nasdaq.
Workhorse manufactures electric vehicles and delivery drones. Biden could be really good for various electric vehicles, such as Tesla too.
Workhorse was established in 1998 and initially started by converting pick-ups manufactured by other manufacturers, but after a merger in 2015, it began manufacturing its own vehicles.
What makes this share an attractive investment opportunity?
The logistics industry is flourishing during the pandemic and this will probably not change. Workhorse already has several big names among its clients.
Subsidies from the Biden administration will probably encourage companies to upgrade their fleets to electric models.
But should you buy?
The share has increased considerably in value since June 2020.
The panel at the bottom of the diagram is the volume of the share. Volume is the total number of shares that are traded during a trading day or a fixed period. It’s a measure of the total turnover of shares. Every bar represents a week’s transactions and is added to the total trading volume.
An increase in volume indicates more investor interest. As the price increases, the price movement is supported by energy (volume), which backs the bull trend.
The black trendlines are indicative of a symmetrical triangular pattern. As the price movement starts trending upwards from the beginning of the pattern, it’s assumed that the price movement will eventually break upwards after the consolidation period (the price movement is the symmetrical triangular pattern).
As the share shows strong upward momentum, the price action continues to move upwards.
Downward momentum is slowing down. When upward momentum starts developing, it could help to push the price action upwards. (Momentum is the energy behind the price action that helps to maintain the price movement.)
For the bull trend I would prefer that the share should break out of the triangular pattern, which is in the region $25. Upward potential could then possibly be $30 and maybe even higher. Take profits there.
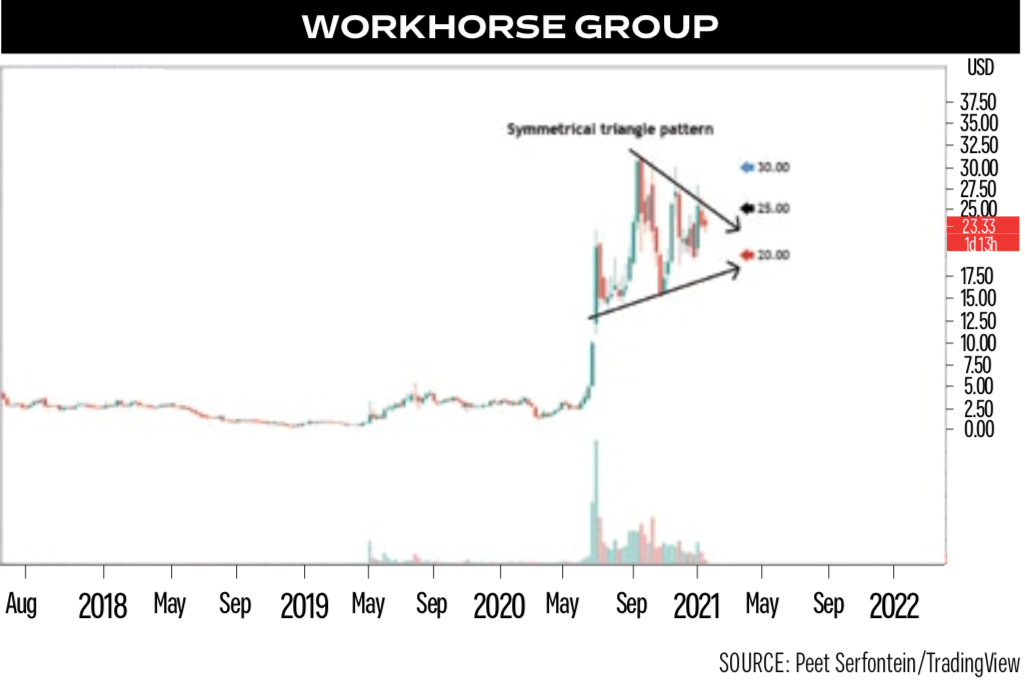
The graph is a medium-term (weekly) graph of WKHS’s share price. Note that the scale is a logarithmic scale. Remember that WKHS is in a volatile sector and that exposure to the share is speculative.